I’ve previously posted about the economic rent derived from India’s coal, oil, and natural gas, sand and iron ore in Goa. In this post, I’m going to share the World Bank’s estimates of rents from all of India’s natural resources, including coal, oil, natural gas, minerals, and forests.
1 Natural resource rents as a percentage of GDP
Below are time series charts from the World Bank’s World Development Indicators datasets, showing our total natural resource rents as a percentage of GDP, followed by its components (coal, oil, natural gas, minerals, and forests) as a percentage of GDP as well.
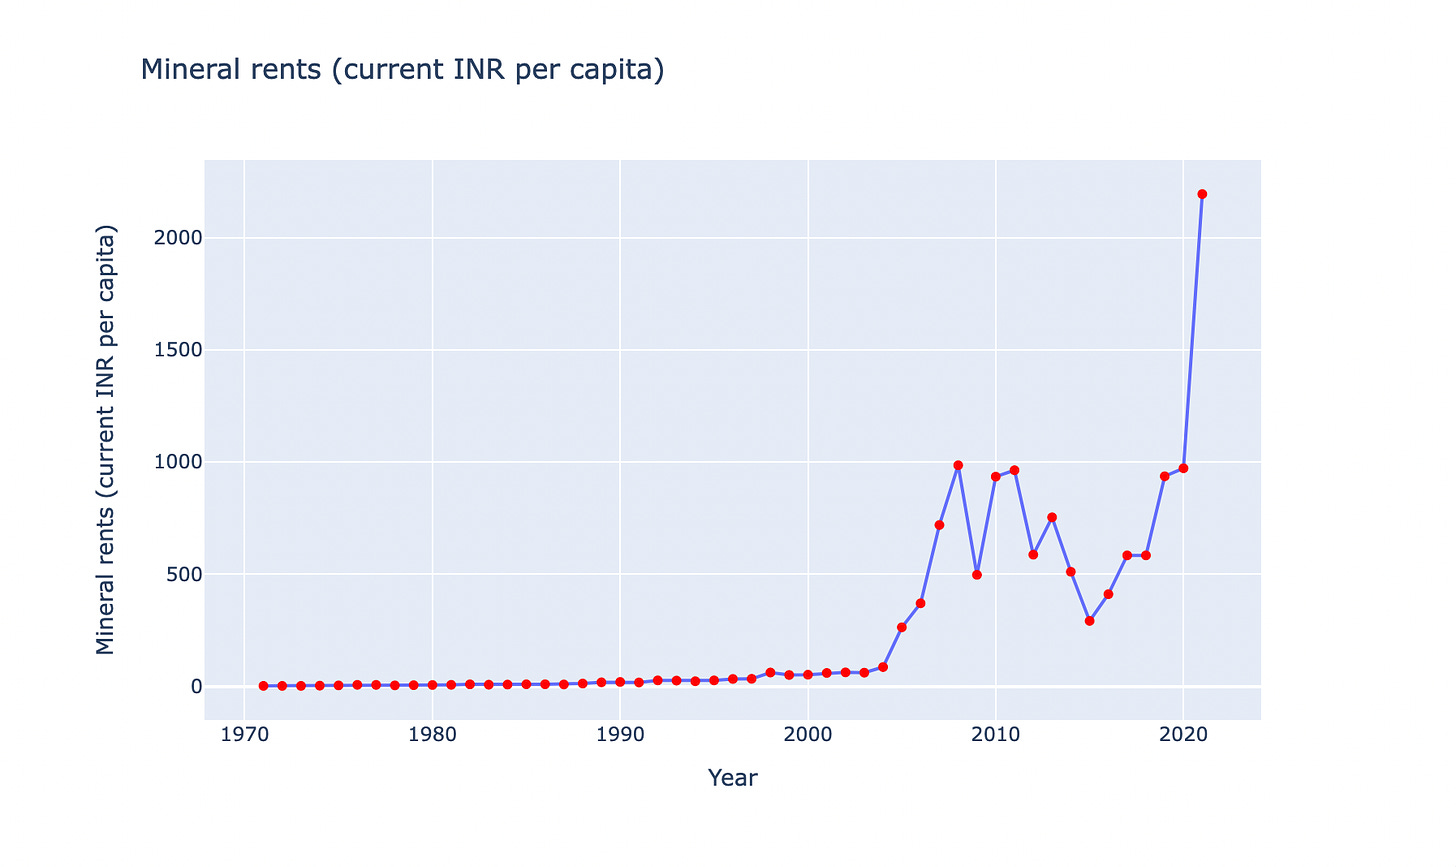
It is important to note that the World Bank defines mineral rents as the resource rents from mining copper, gold, iron ore, lead, nickel, silver, and zinc according to their report “The Changing Wealth of Nations 2021: Managing Assets for the Future,” but it defines resource rents from mining tin, gold, lead, zinc, iron, copper, nickel, silver, bauxite, and phosphate according to the page on their website where the data has been sourced. This is the only dataset where there is some discrepancy; for the rest, the World Bank’s publications are consistent.
The World Bank details the sources used to estimate the rents in their report “The Changing Wealth of Nations 2021: Managing Assets for the Future” (TABLE A.6 contains the relevant text):

From this data and additional World Bank datasets, I’ve compiled more time series charts that display the rents for each natural resource classification in terms of their value per capita in INR (both in current prices and adjusted for inflation). Adjusting for inflation is crucial for understanding the significance of a potential citizen’s dividend. Additionally, I’ve included a time series chart that illustrates the contribution of each type to the total. All the data used to create these charts is published on Kaggle and Github. I recommend viewing the charts here for an interactive experience (for example, you can hover over the points to see the exact (x,y) coordinates, zoom without losing quality, etc), but I have also attached them to this post for convenience.
2 Natural resource rents per capita
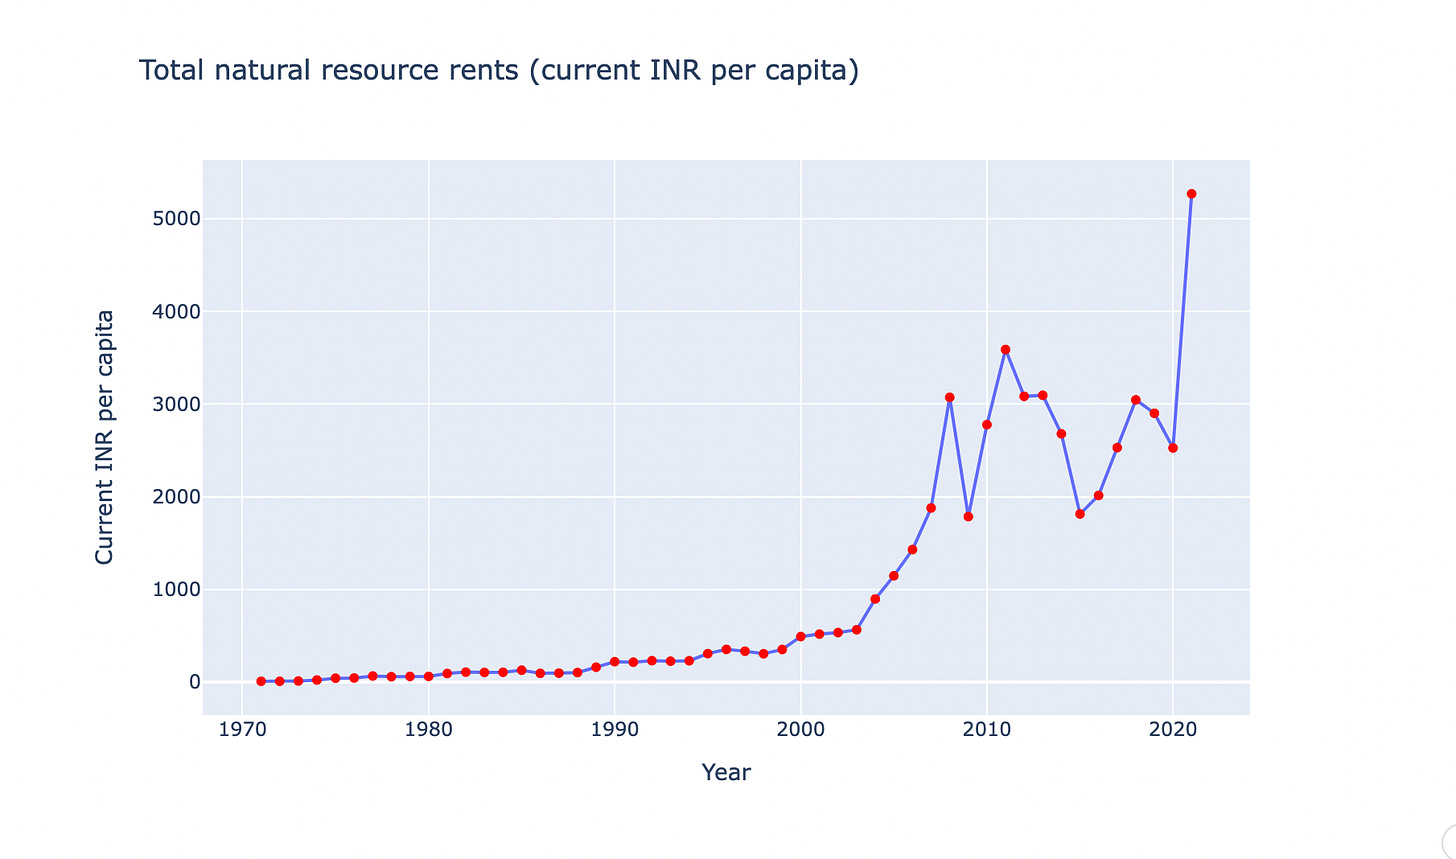
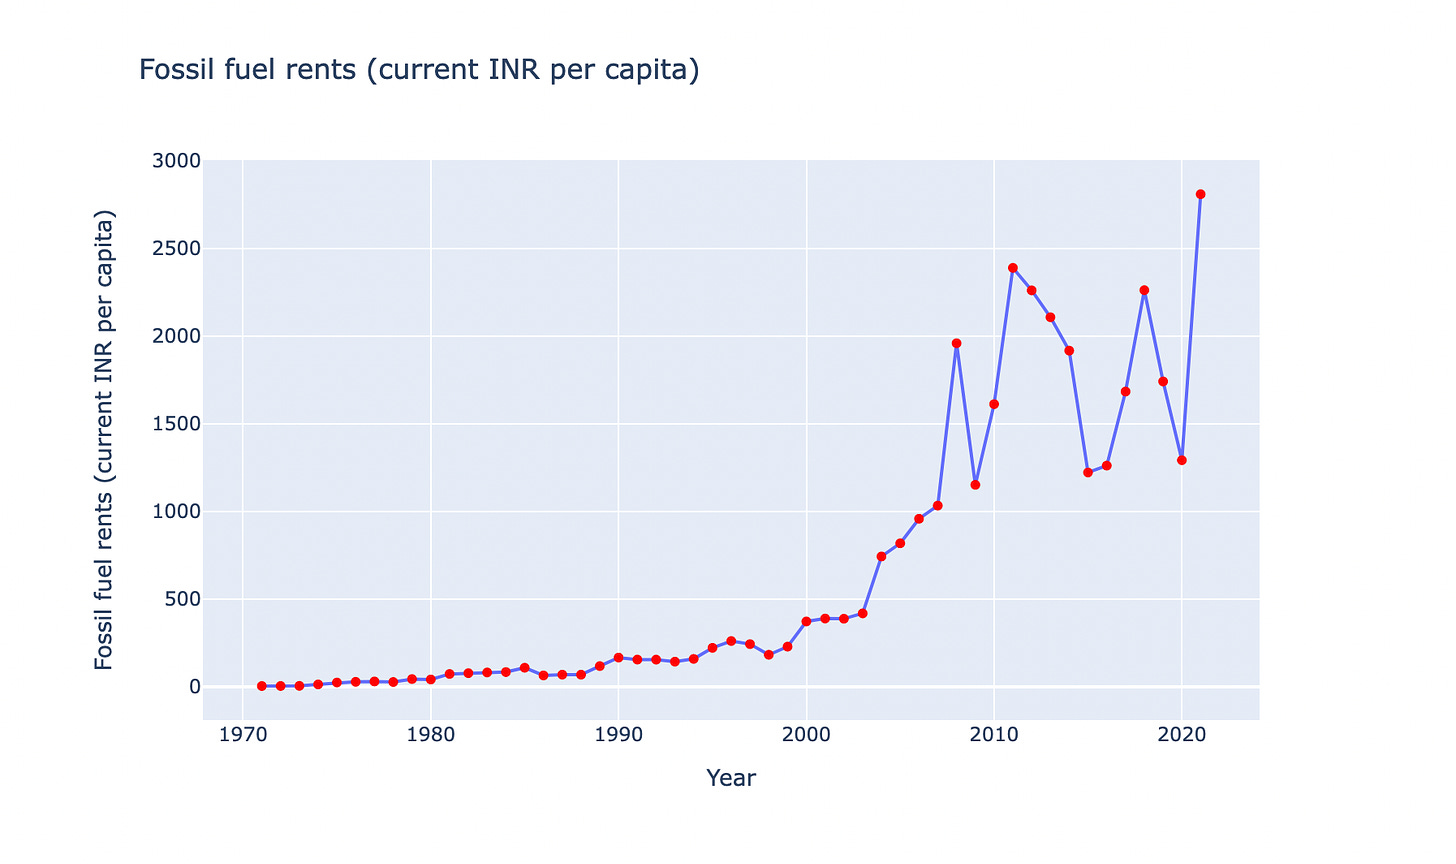
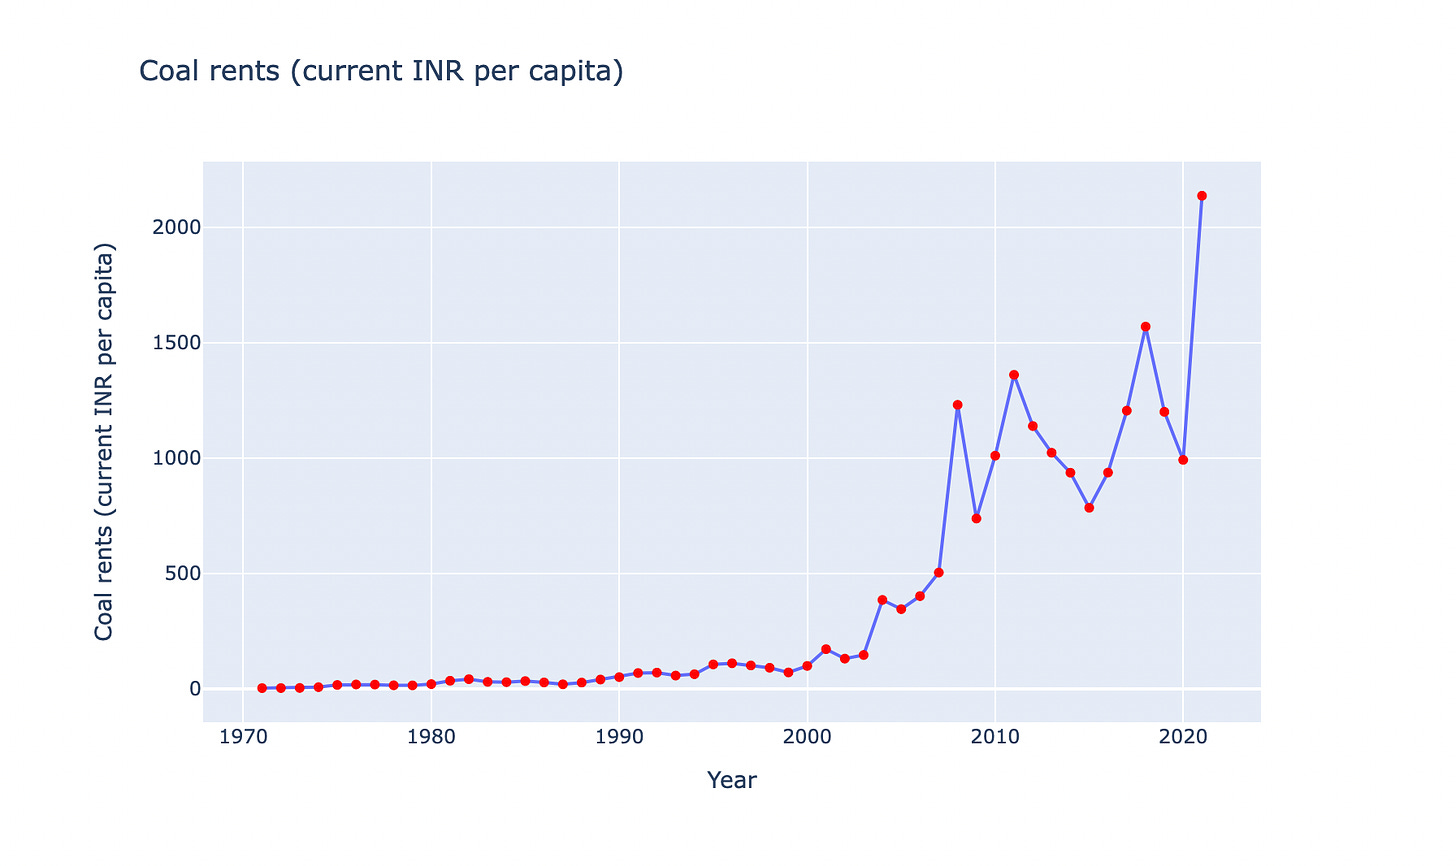
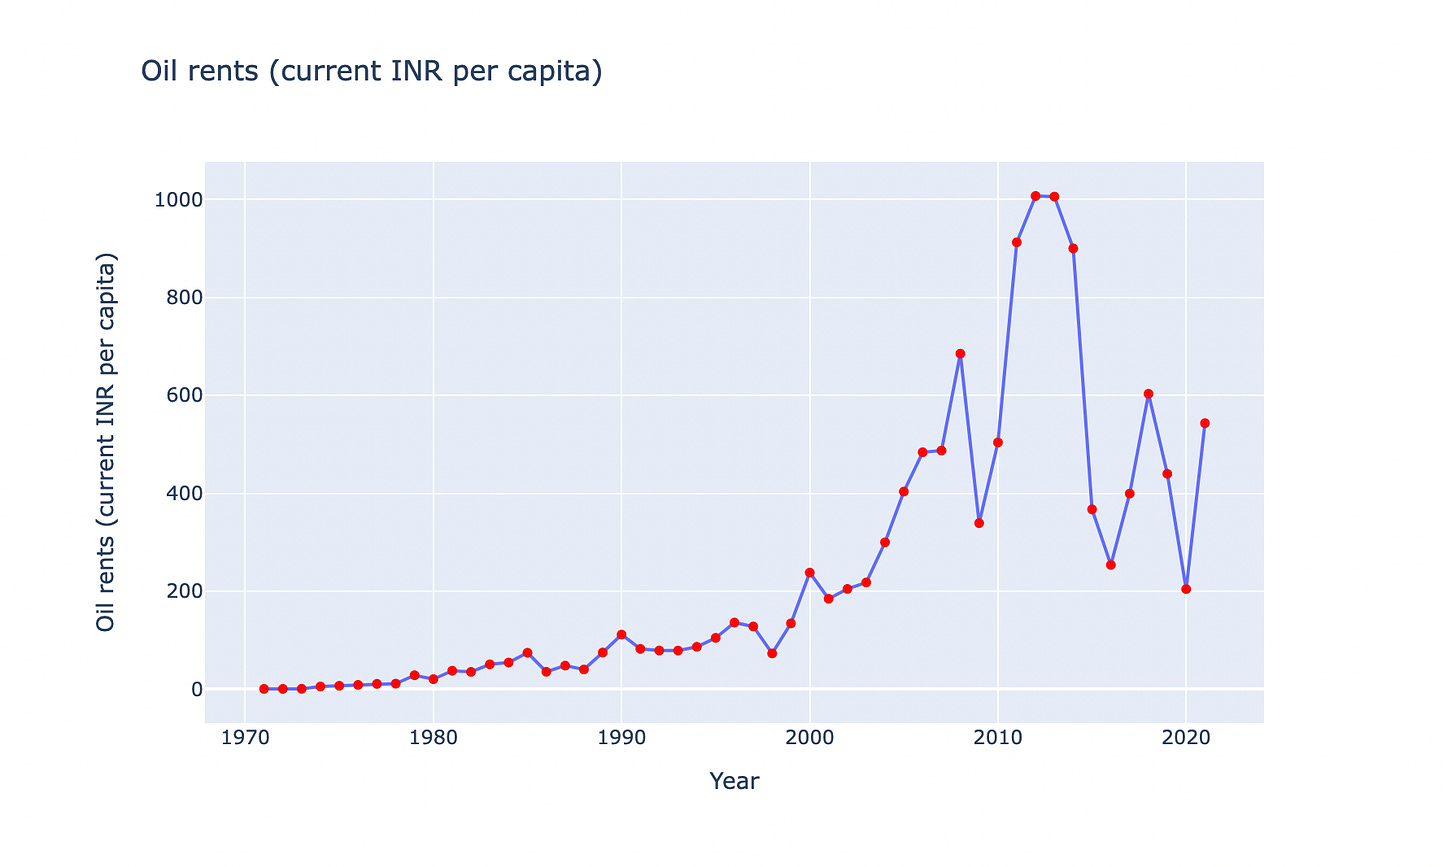
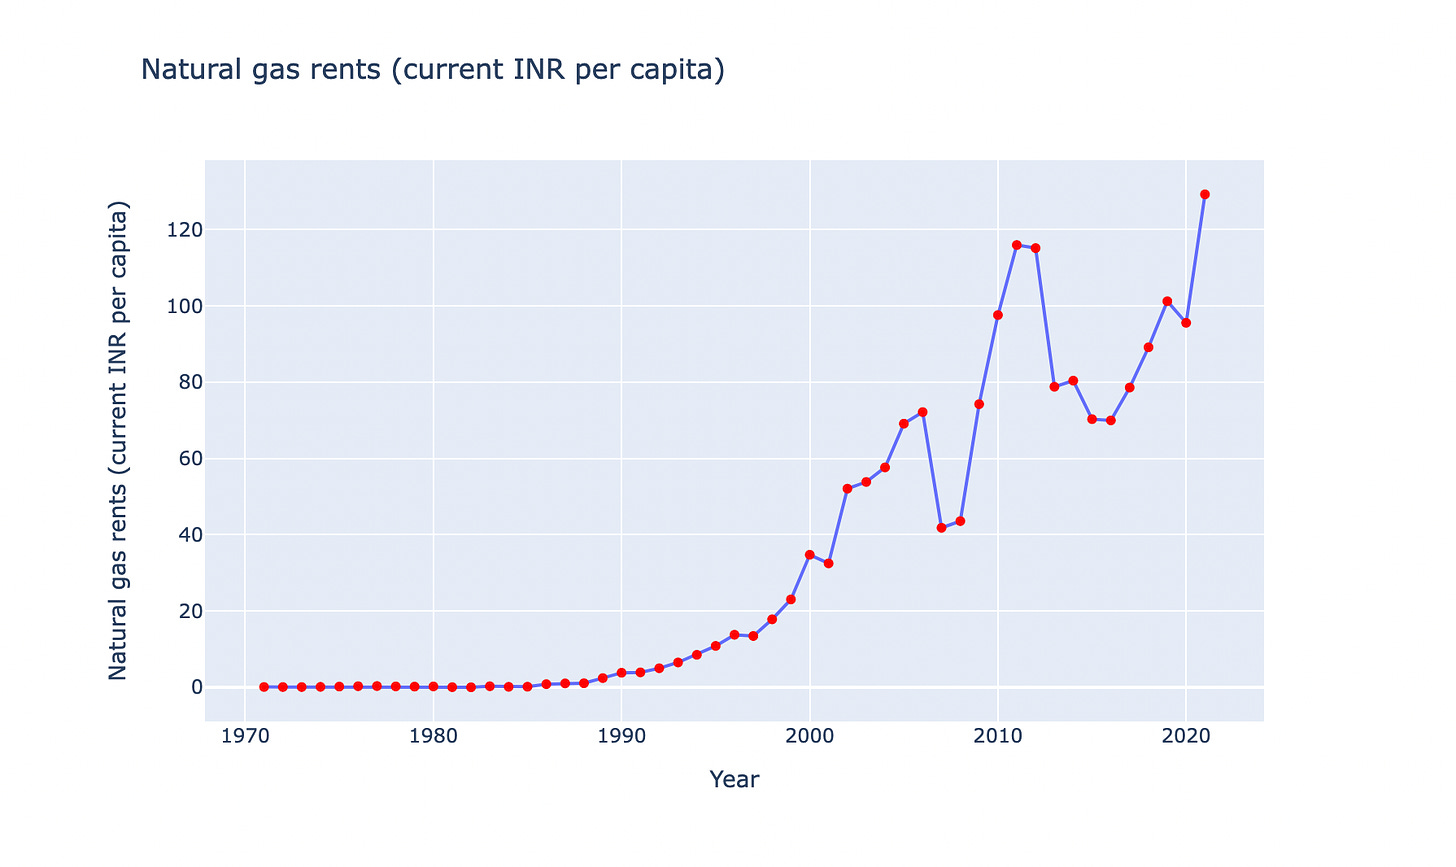
The following are per capita values for the rents (not adjusted for inflation) of total natural resource rents, all fossil fuels, and separately for coal, oil, natural gas, minerals, and forests.

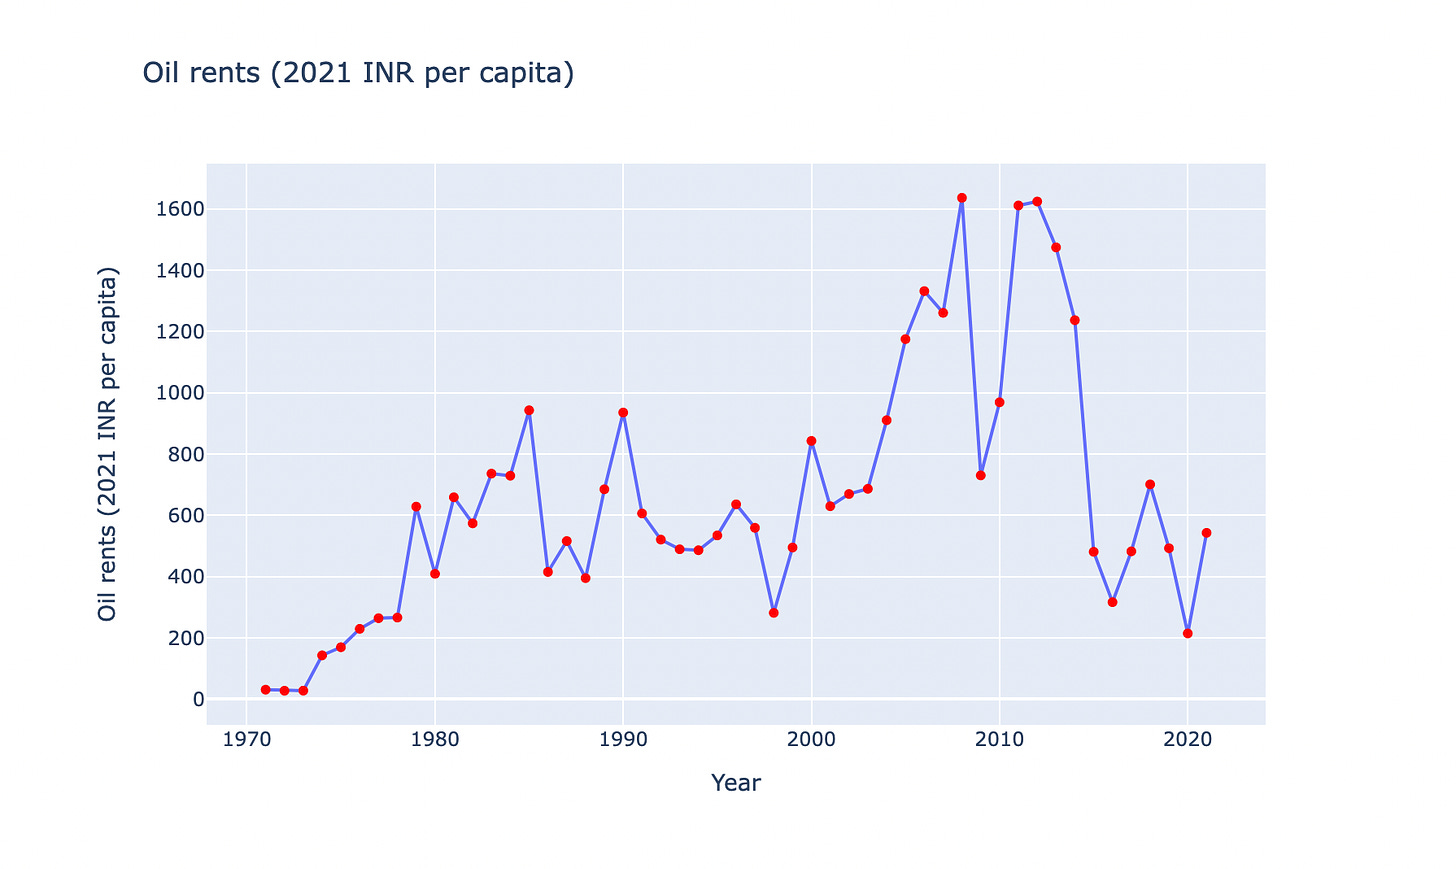
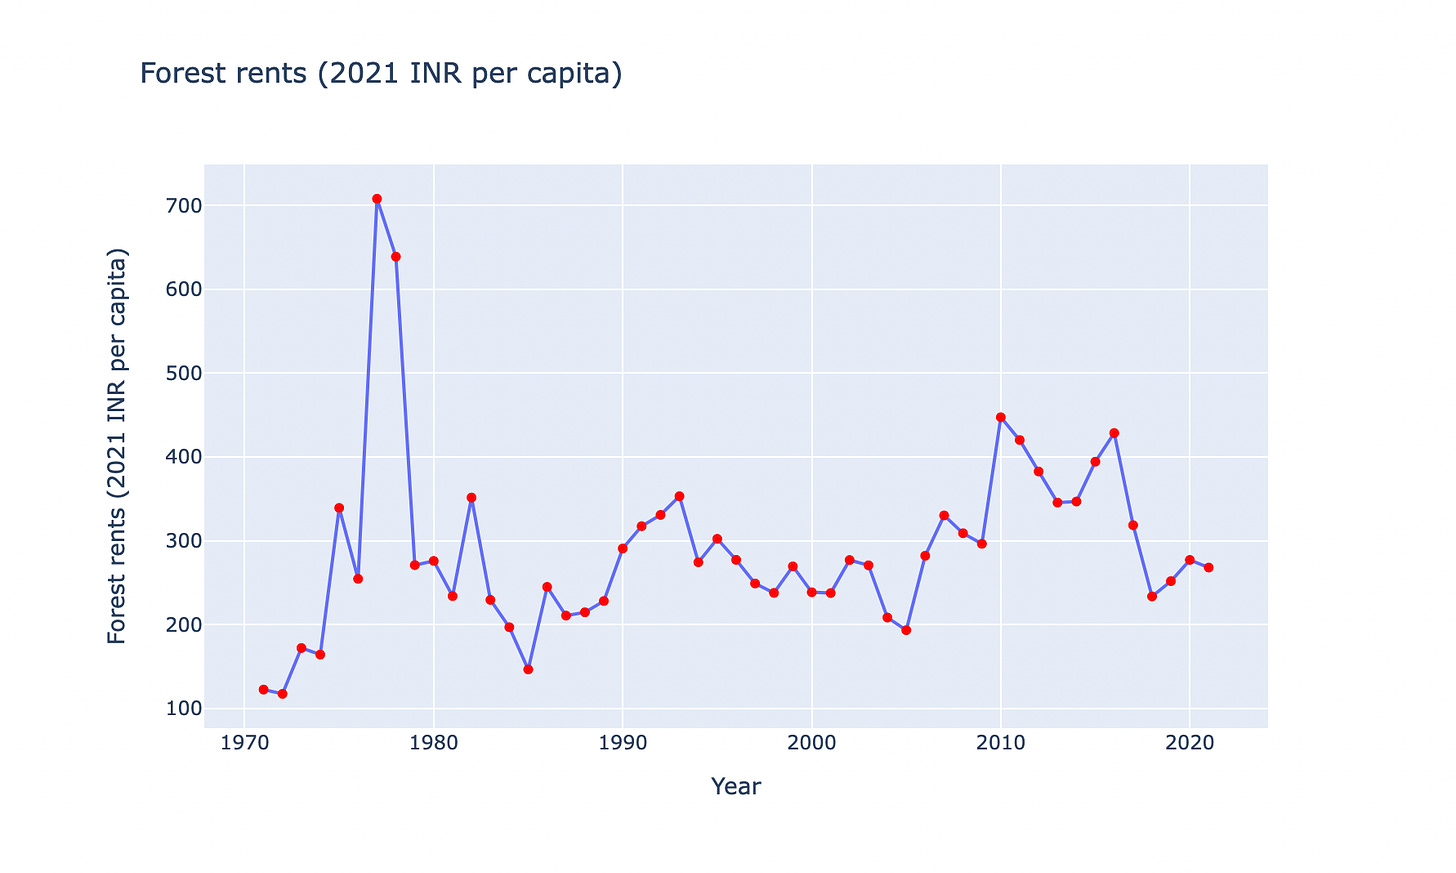
3 Natural resource rents per capita in 2021 INR (useful to know the impact of a citizen’s dividend)
The following are the same figures as above but adjusted for inflation in constant 2021 INR. Adjusting for inflation might be important for someone who is interesting in knowing the effects of a citizen’s dividend sourced from natural resource rents.


And this is how various categories of natural resources have contributed differently to the aggregate rent over the years.

There are various factors that could lead to the government collecting less or more than the estimated rent from mining activities. These factors are extensively discussed in the reports “Many ways to lose a billion” by PWYP Canada and “Fiscal Regimes for Extractive Industries: Design and Implementation” by the International Monetary Fund (IMF). I plan to delve into these reasons in a follow-up post. (hat tip: Rahul Basu)